Interaction Scheme
Molecule
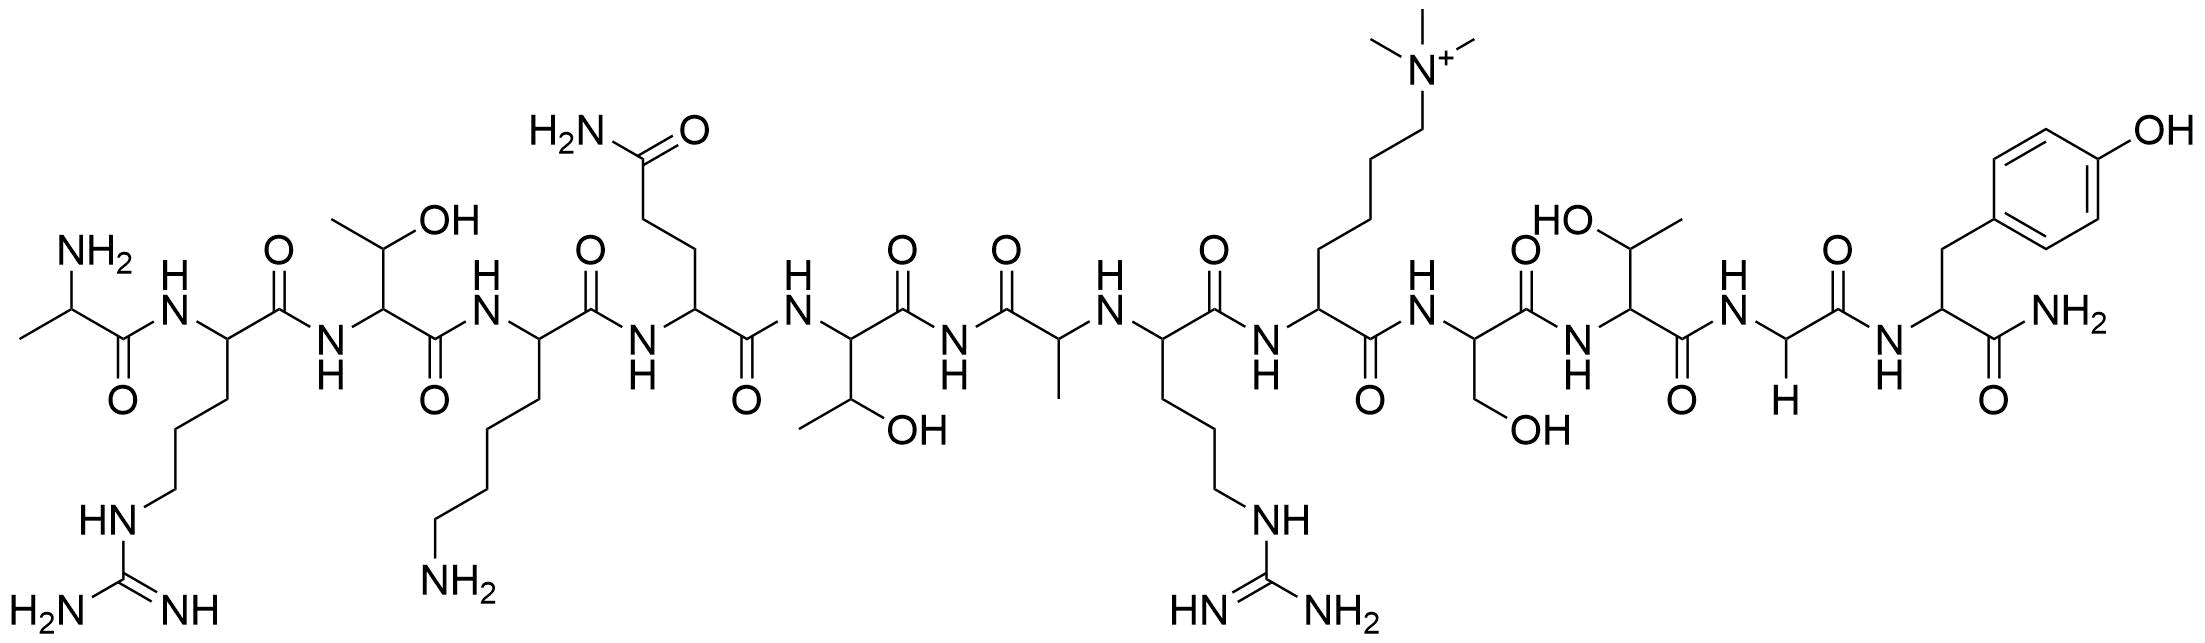
ARTKQTARK(me3)STGY
Host
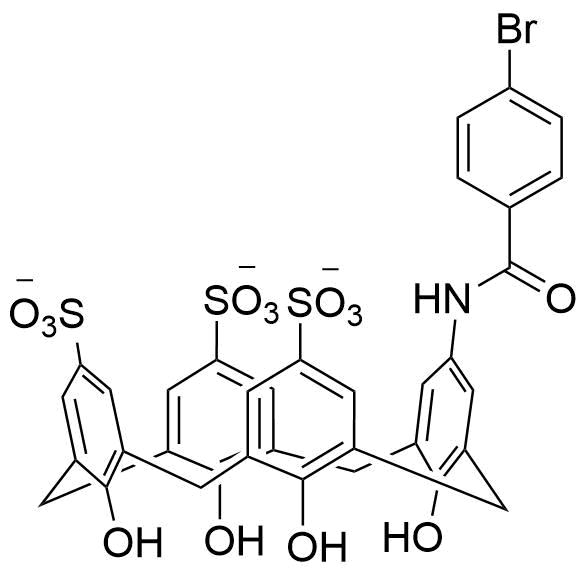
sCx4-NHCO(4-Br)Ph
Indicator
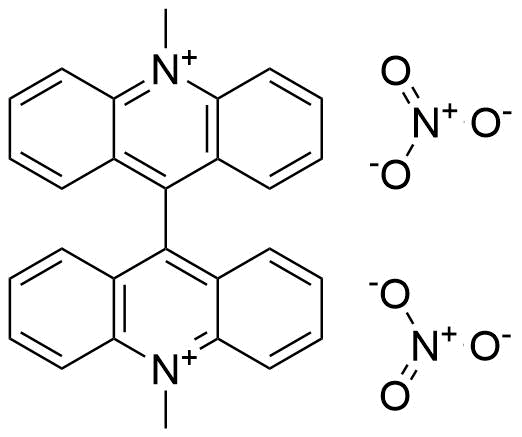
Lucigenin
Binding Properties
| 𝜈 | Molecule 1 : 1 Host | ||
| Ka = | 1.10⋅106 | ± 9.70⋅104 | M-1 |
| Kd = | |||
| logKa = | |||
| T | 25.0 °C | ||
| Energy | kJ mol-1 | kcal mol-1 | |||
|---|---|---|---|---|---|
| ΔG | = | -34.48 | ± 0.22 | -8.24 | ± 0.05 |
These are the specifications of the determination of the experimental results.
| Detection Method: | Competitive | |||
| Assay Type: | Competitive Binding Assay | |||
| Technique: | Fluorescence | |||
| 𝛌ex | = | 369.0 nm | ||
| 𝛌em | = | 485.0 nm | ||
Detailed information about the solvation.
| Solvent System | Buffer System | 10 mM phosphate pH-7.4 |
| Solvents | water | 100.0 % |
| Additives | Disodium phosph... | 7.5 mM |
| Sodium dihydro... | 2.5 mM | |
| Source of Concentration | ||
| Total concentration | 10.0 mM | |
| pH | 7.4 |
Please find here information about the dataset this interaction is part of.
| Citation: |
F. Hof, H. Allen, K. Daze, T. Shimbo, A. Lai, C. Musselman, J. Sims, P. Wade, T. Kutateladze, SupraBank 2024, Inhibition of histone binding by supramolecular hosts (dataset). https://doi.org/10.34804/supra.20210928134 |
| Link: | https://doi.org/10.34804/supra.20210928134 |
| Export: | BibTex | RIS | EndNote |
Please find here information about the scholarly article describing the results derived from that data.
| Citation: |
H. F. Allen, K. D. Daze, T. Shimbo, A. Lai, C. A. Musselman, J. K. Sims, P. A. Wade, F. Hof, T. G. Kutateladze, Biochemical Journal 2014, 459, 505–512. |
| Link: | https://doi.org/10.1042/BJ20140145 |
| Export: | BibTex | RIS | EndNote |
Binding Isotherm Simulations
The plot depicts the binding isotherm simulation of a 1:1 interaction of ARTKQTARK(me3)STGY (1.8181818181818182e-05 M) and sCx4-NHCO(4-Br)Ph (0 — 3.6363636363636364e-05 M).
Please sign in: customize the simulation by signing in to the SupraBank.