Interaction Scheme
Molecule
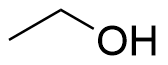
Ethanol
c = 7050.0 µM
Host
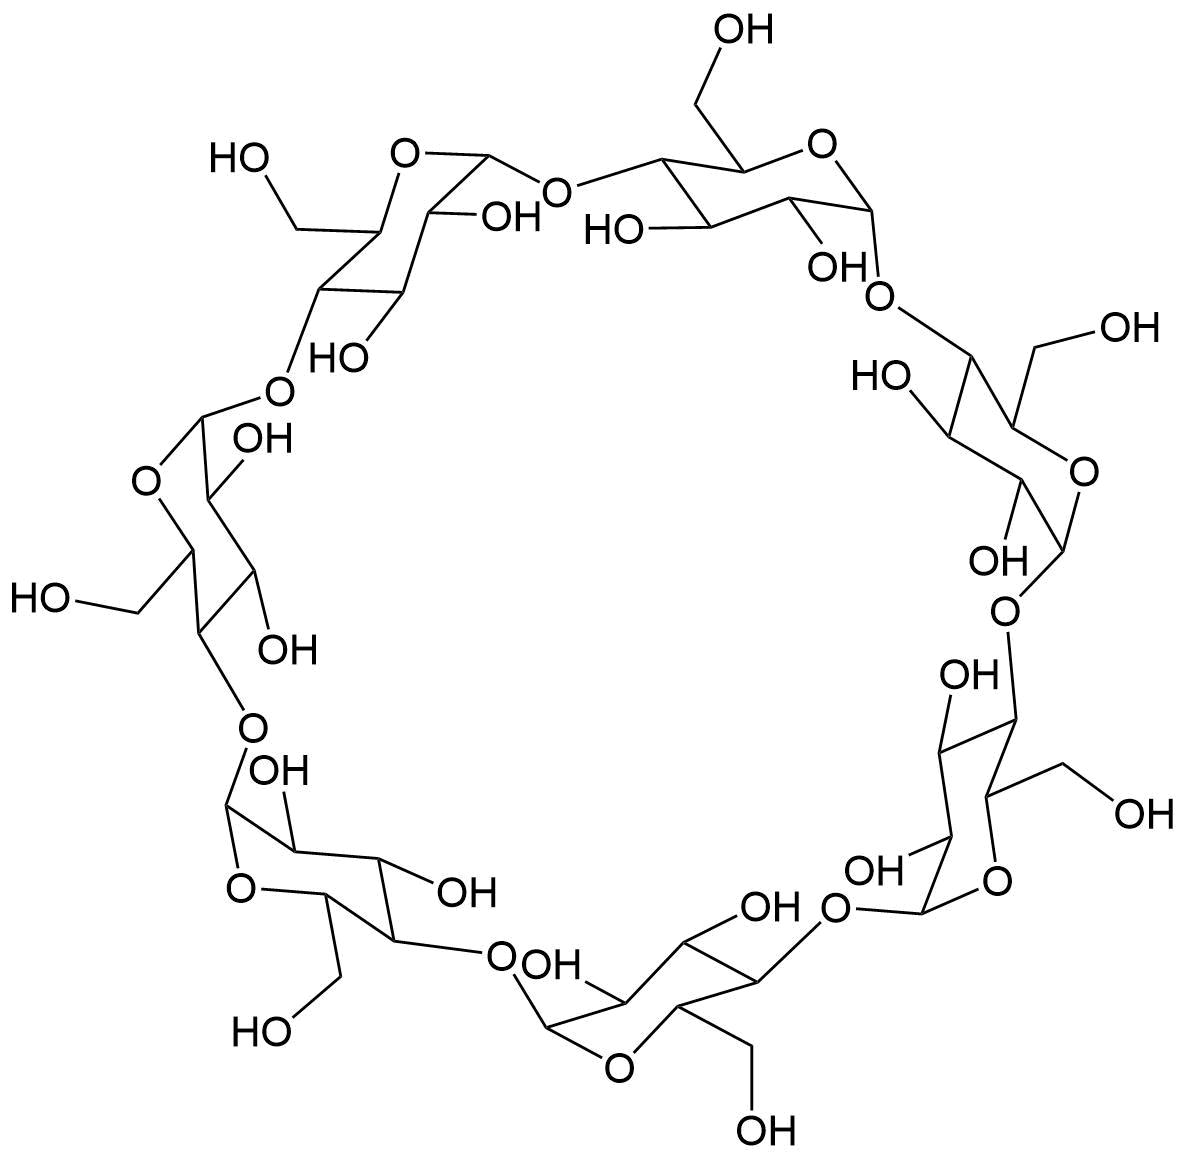
β-CD
c = 100.0 µM
Indicator
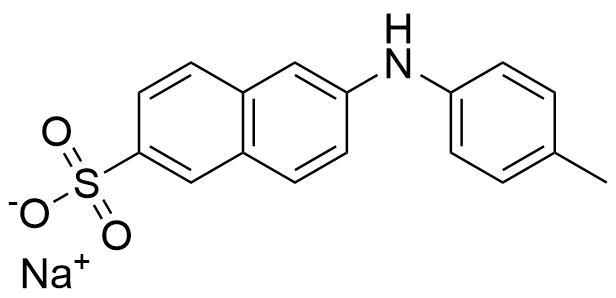
2,6-TNS
c = 0.0 — 691.0 µM
Binding Properties
| 𝜈 | Molecule 1 : 1 Host | ||
| Ka = | 85.11 | ± 1.96 | M-1 |
| Kd = | |||
| logKa = | |||
| T | 25.0 °C | ||
| Energy | kJ mol-1 | kcal mol-1 | |||
|---|---|---|---|---|---|
| ΔG | = | -11.02 | ± 0.06 | -2.63 | ± 0.01 |
These are the specifications of the determination of the experimental results.
| Detection Method: | Competitive | |||
| Assay Type: | Competitive Binding Assay | |||
| Technique: | Fluorescence | |||
| 𝛌ex | = | 405.0 nm | ||
| 𝛌em | = | 550.0 nm | ||
Detailed information about the solvation.
| Solvent System | Single Solvent |
| Solvent | water |
Please find here information about the dataset this interaction is part of.
| Citation: |
F. Biedermann, S. Sinn, J. Krämer, SupraBank 2026, Teaching old indicators even more tricks: binding affinity measurements with the guest-displacement assay (GDA) (dataset). https://doi.org/10.34804/supra.20210928361 |
| Link: | https://doi.org/10.34804/supra.20210928361 |
| Export: | BibTex | RIS | EndNote |
Please find here information about the scholarly article describing the results derived from that data.
| Citation: |
S. Sinn, J. Krämer, F. Biedermann, Chem. Commun. 2020, 56, 6620–6623. |
| Link: | https://doi.org/10.1039/D0CC01841D |
| Export: | BibTex | RIS | EndNote | |
Binding Isotherm Simulations
The plot depicts the binding isotherm simulation of a 1:1 interaction of Ethanol (0.2349900129244507 M) and β-CD (0 — 0.4699800258489014 M).
Please sign in: customize the simulation by signing in to the SupraBank.