Interaction Scheme
Molecule
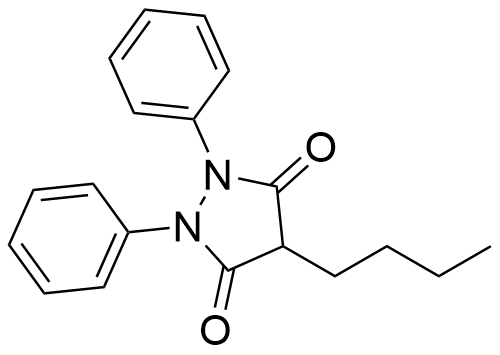
phenylbutazone
c = 21.0 µM
Host
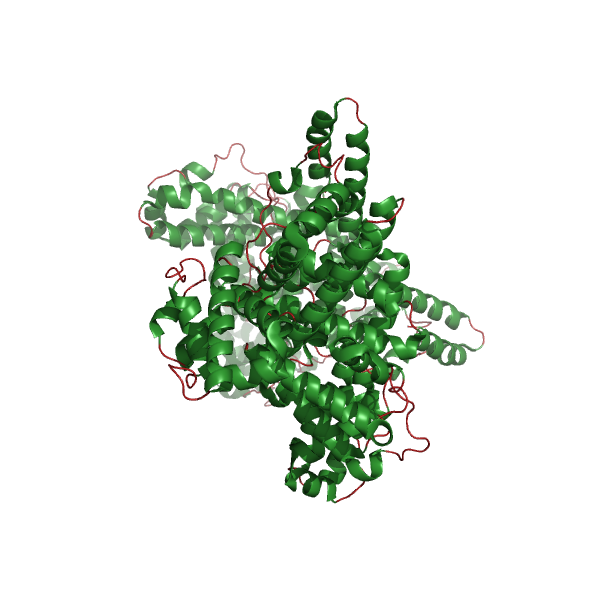
HSA
c = 10.0 µM
Indicator
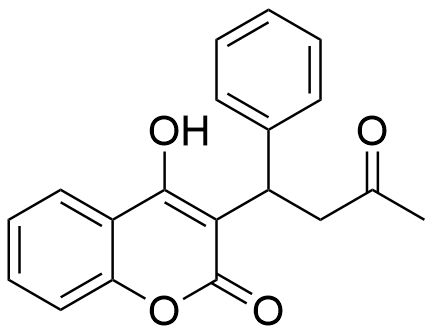
warfarin
c = 0.0 — 32.0 µM
Binding Properties
| 𝜈 | Molecule 1 : 1 Host | ||
| Ka = | 6.76⋅105 | ± 6.24⋅104 | M-1 |
| Kd = | |||
| logKa = | |||
| T | 25.0 °C | ||
| Energy | kJ mol-1 | kcal mol-1 | |||
|---|---|---|---|---|---|
| ΔG | = | -33.28 | ± 0.23 | -7.95 | ± 0.05 |
These are the specifications of the determination of the experimental results.
| Detection Method: | Competitive | |||
| Assay Type: | Competitive Binding Assay | |||
| Technique: | Fluorescence | |||
| 𝛌ex | = | 335.0 nm | ||
| 𝛌em | = | 410.0 nm | ||
Detailed information about the solvation.
| Solvent System | Buffer System | 1X PBS pH-7.4 |
| Solvents | water | |
| Additives | sodium chloride | 137.0 mM |
| Disodium hydrog... | 10.0 mM | |
| potassium chloride | 2.7 mM | |
| Potassium dihyd... | 1.8 mM | |
| Source of Concentration | real | |
| Total concentration | 151.5 mM | |
| pH | 7.4 |
Please find here information about the dataset this interaction is part of.
| Citation: |
F. Biedermann, S. Sinn, J. Krämer, SupraBank 2026, Teaching old indicators even more tricks: binding affinity measurements with the guest-displacement assay (GDA) (dataset). https://doi.org/10.34804/supra.20210928361 |
| Link: | https://doi.org/10.34804/supra.20210928361 |
| Export: | BibTex | RIS | EndNote |
Please find here information about the scholarly article describing the results derived from that data.
| Citation: |
S. Sinn, J. Krämer, F. Biedermann, Chem. Commun. 2020, 56, 6620–6623. |
| Link: | https://doi.org/10.1039/D0CC01841D |
| Export: | BibTex | RIS | EndNote | |
Binding Isotherm Simulations
The plot depicts the binding isotherm simulation of a 1:1 interaction of phenylbutazone (2.9581422866439876e-05 M) and HSA (0 — 5.916284573287975e-05 M).
Please sign in: customize the simulation by signing in to the SupraBank.